Did You Know…? Carotenemia is an illness caused by the consumption of too many carrots. Its most obvious symptom is orange skin.
Good afternoon,
Today in Math, the Grade 4 students and I reviewed their lessons on bar graphs, as many students had questions about the homework this morning. To review, we worked on question 3 and 4 together as a class. Question 3 asked students to construct a double bar graph using the data below:
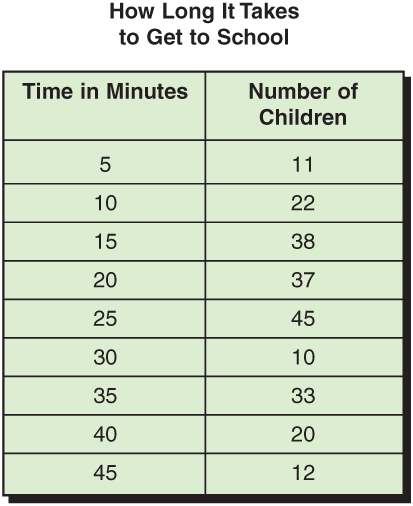
Looking at the data, the students and I then began to construct our bar graph. We know that a bar graph contains the title, horizontal axis, vertical axis, and a scale, so that is where we began. We decided to construct our scale using the number of children. We noticed that the numbers started at 10 and went up to 45. Since these are both multiples of 5, we counted up by 5. We created a vertical bar graph, so our scale went on the vertical axis, and we labelled it “Number of Children.” That means that our horizontal axis needed to be labelled “Time in Minutes” and we had to put each of the numbers from 5-45 on that axis as well, also counting by 5’s. Finally, we filled in the data. For example, we can see that 11 students took 5 minutes to get to school. So, we drew a vertical bar from the 5, up to 11 on the scale. Because we don’t have 11 on the scale, we estimated and drew it a little higher than 10. Finally, we titled the bar graph. Since the table we used already had a title, we decided to also title it “How Long it Takes to Get to School.” You can see our completed bar graph below:
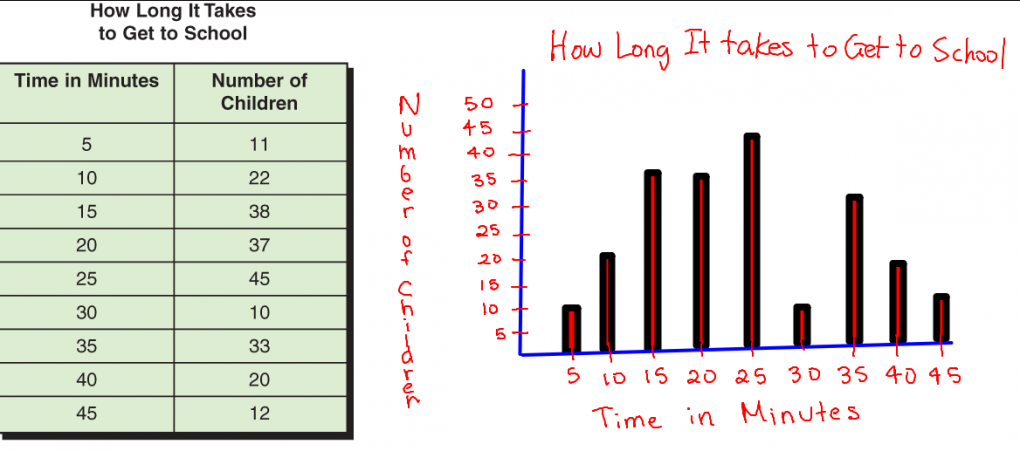
To finish the question, we had to complete b) and c). In b) we were asked to compare our graph to another classmates. I reminded students that if they are working on a question at home, that it would be okay to skip a question like this, as they don’t have a classmate to check their work with. Moving on to c) we were asked “How many children take the greatest time?” Looking at the bar graph, I can see that 45 minutes is the longest time it takes students to get to school. As this line is between 10-15, I would estimate about 12 children take 45 minutes to get to school. I can confirm this using the data in the chart. Finally, d) asked us to consider whether we thought the students who only needed 5 minutes lived close or far from the school. As a class, we decided that they likely lived close to school, which is why they had a quicker trip to school.
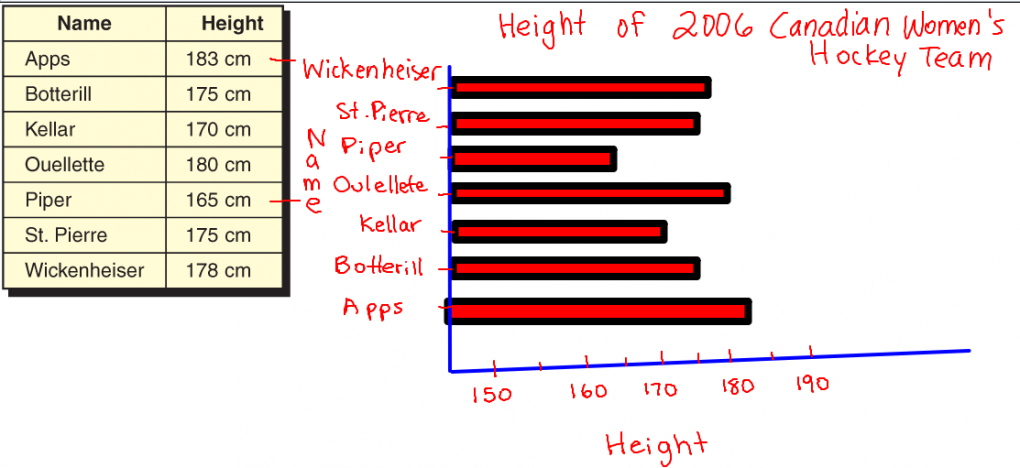
You can also see the bar graph that we constructed for question 4 below, as another exemplar for students:
I asked students to take questions #1-4 back home tonight and to try their best to complete them now that we had some review as a class.
In Science today, the Grade 5 students learned about convection currents. A convection current is the direction that air moves due to different temperatures between air masses. So that we could see a convection current in motion, we completed an experiment together. We used a strip of paper at both the top and the bottom of a door to see the direction the air moved. When looking at the air in our classroom and the air in the hallway, we noticed that the papers did not move as much. This is likely because both are around room temperature and that there was not a large difference between the temperatures of these two air masses. However, we did note that the paper at the top of the door appeared to move outwards (from our classroom into the hallway) and that the paper at the bottom of the door appeared to move inwards (from the hallway into the room). Then we moved to the hallway and the outside door. We hoped that this would be easier to observe, because there would be a larger difference in the temperatures. Again, we noted that the paper at the top of the door appeared to move outwards, while the paper at the bottom of the door appeared to move inwards. Finally, we reviewed our results as a class. Cool air moves towards warm air in a convection current. Since the cool air falls, the cool air from outside (where it was cooler) came rushing in at the bottom of the door. To equalize the air pressure, warm air at the top of the door moves out. Think of it as the warm air making room for the cold air. The students recorded their results in our notebooks, and began a reflection on their previous learning.
The Grade 4 students continued to discuss waste and whether or not something is biodegradable or non-biodegradable. The worked together to complete the following chart:
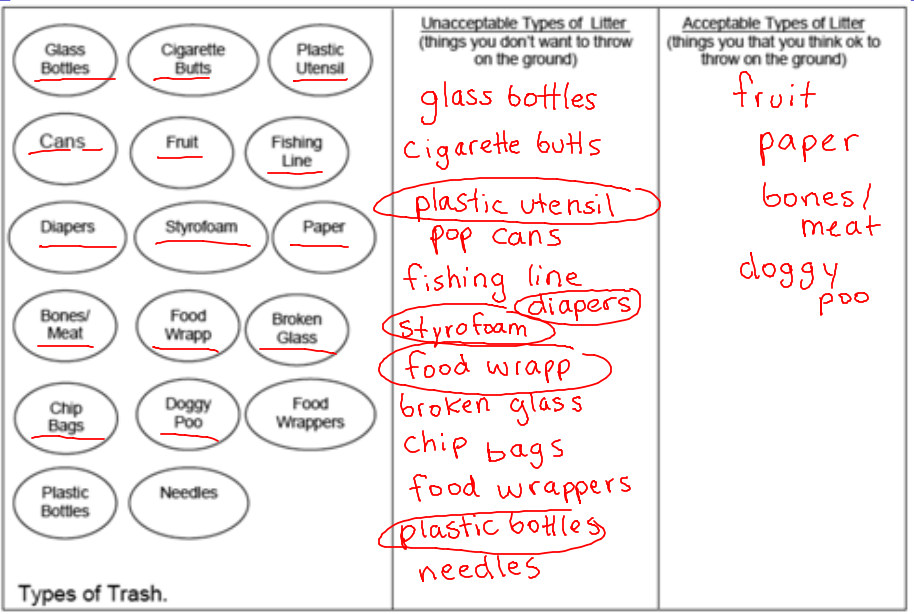
Then we discussed items that we could avoid using, to reduce the amount of waste we produce. We came up with plastic utensils, diapers, styrofoam, food wrap, and plastic bottles. All of these have alternatives that we could use instead, such as dishes, metal utensils, glass/metal (reusable) water bottles, or even cloth diapers. Next class, we will be discussing some decomposition rates.
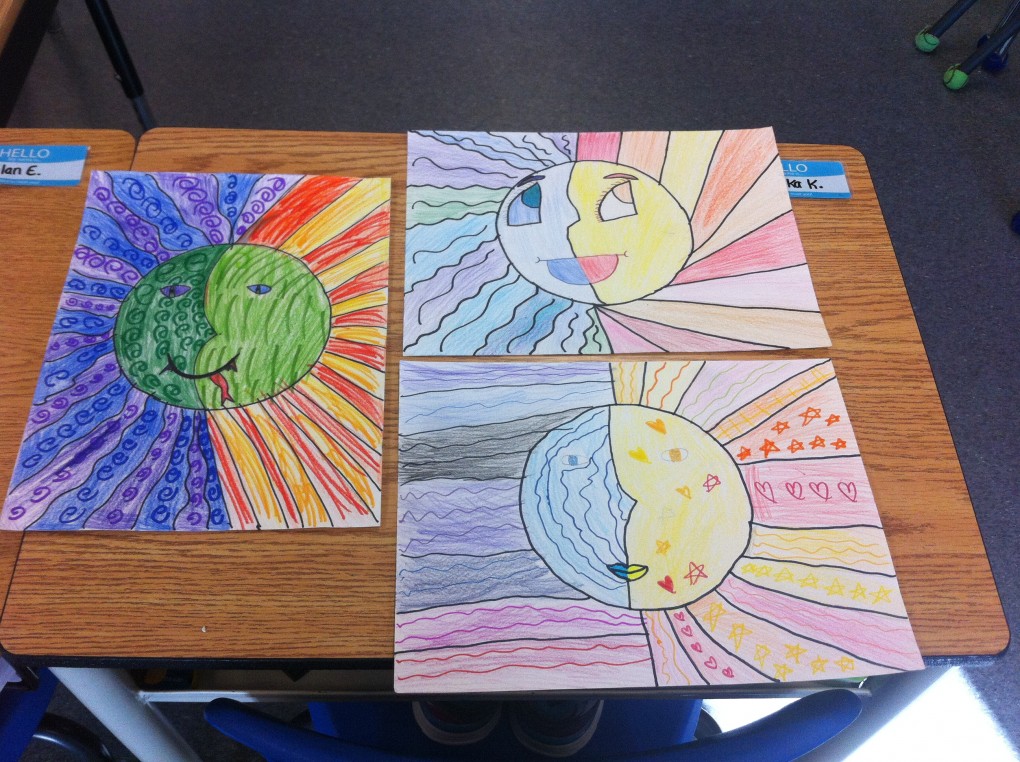
Students also had Art with Mr. Dhooma for the first time today. We were interrupted by our first fire drill of the year, but it went very well everyone. When we returned to class, students continued to work on their “Hot Sun, Cool Moon” projects from last week. Check out some completed projects below.
In Language Arts today, we reviewed what we had been learning about making predictions. We have practiced using the information from the text and our own knowledge (schema) to make predictions before, during, and then reflecting after reading. Today we added something new – inference. An inference is a conclusion reached on the basis of evidence and strong reasoning. Sometimes we have enough information from the text or enough previous learning in our schema to KNOW what will happen next. We watched the following video clip as an example:
We all knew what was going to happen once the larger bird fell off. Using our schema, we could easily see that it was like a slingshot and that the birds were going to end up flying up in the air. This is an inference that we could make. However, we didn’t all know what would happen to the birds after. We could have predicted, but we didn’t know they would lose their feathers.
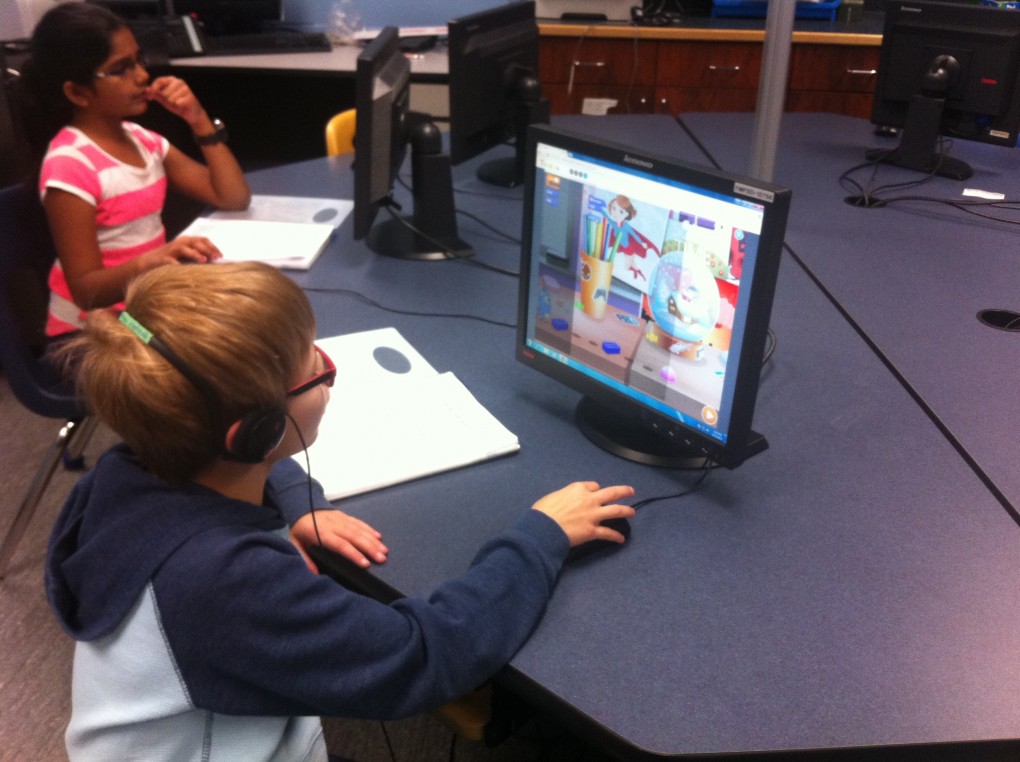
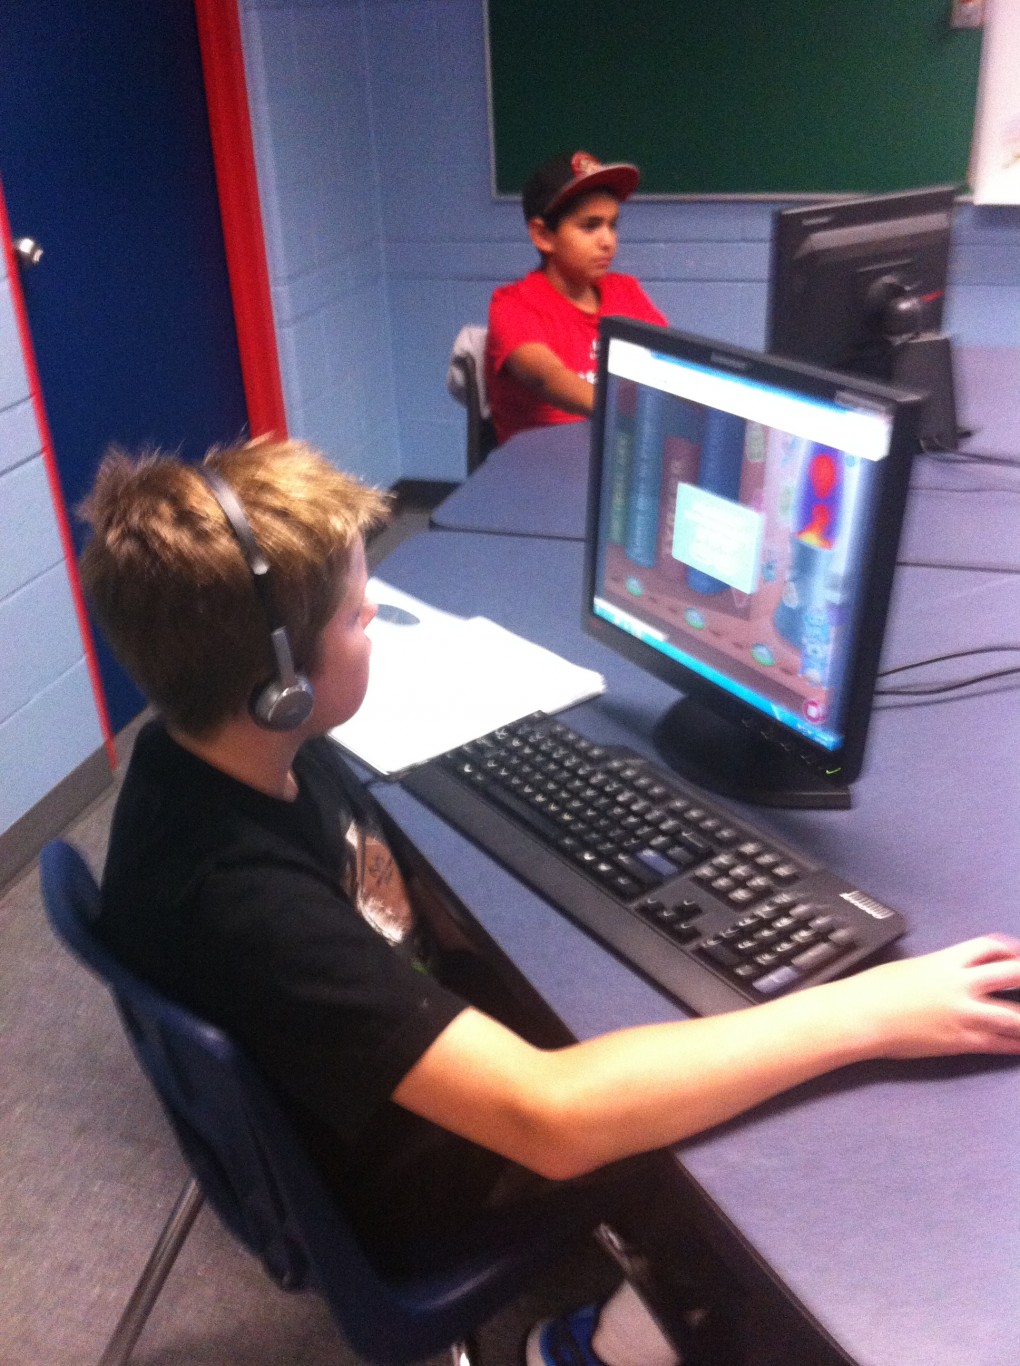
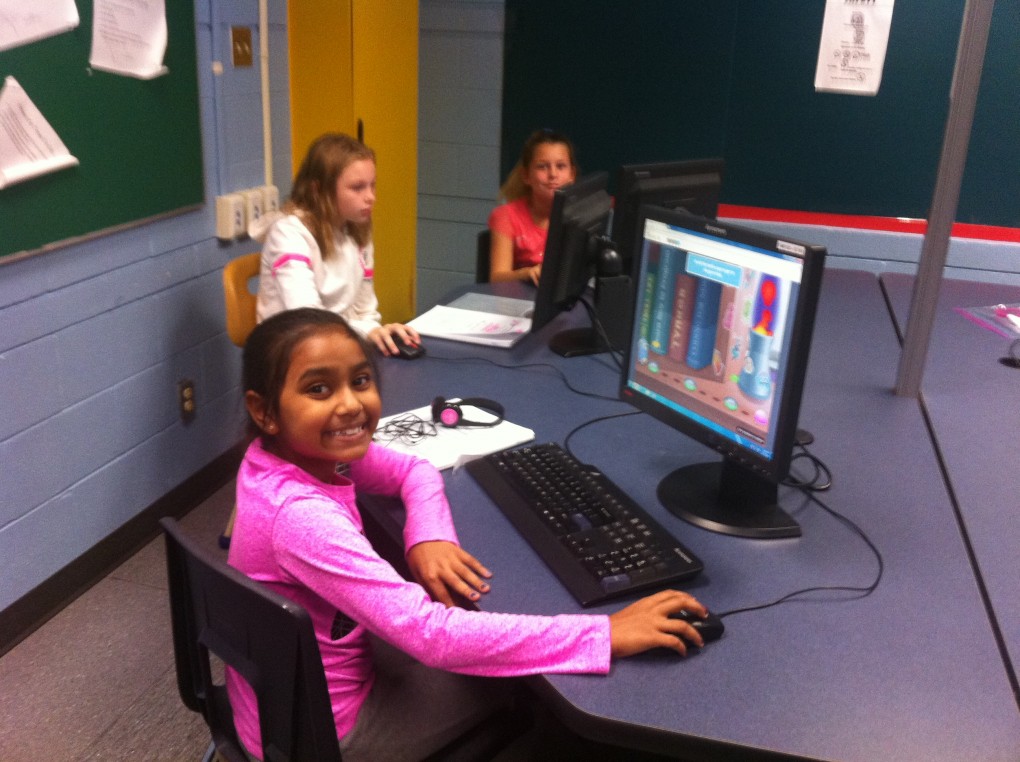
Finally, here is the link for the website we used during Computers yesterday:
I’ve also added it to our quicklinks. You can find it under “Frequently Used” when you click on the search button, or under STEM under our other subjects. Have fun tynkering at home everyone!
Agenda:
Read 20 minutes
Math: pgs. 263-264 #1-4 (Grade 4)
Science: Climate/Weather Foldables (tomorrow!)
Book Orders – Sept. 25th